Record shows usage-pattern charts for your bot. Use the Date Filter menu (7 Days, Last 30 Days, Last Month, Last 3 Months, Current Month, Current Year, Last Year, or All Time) to scope the data — selecting 7 Days also reveals a week selector.
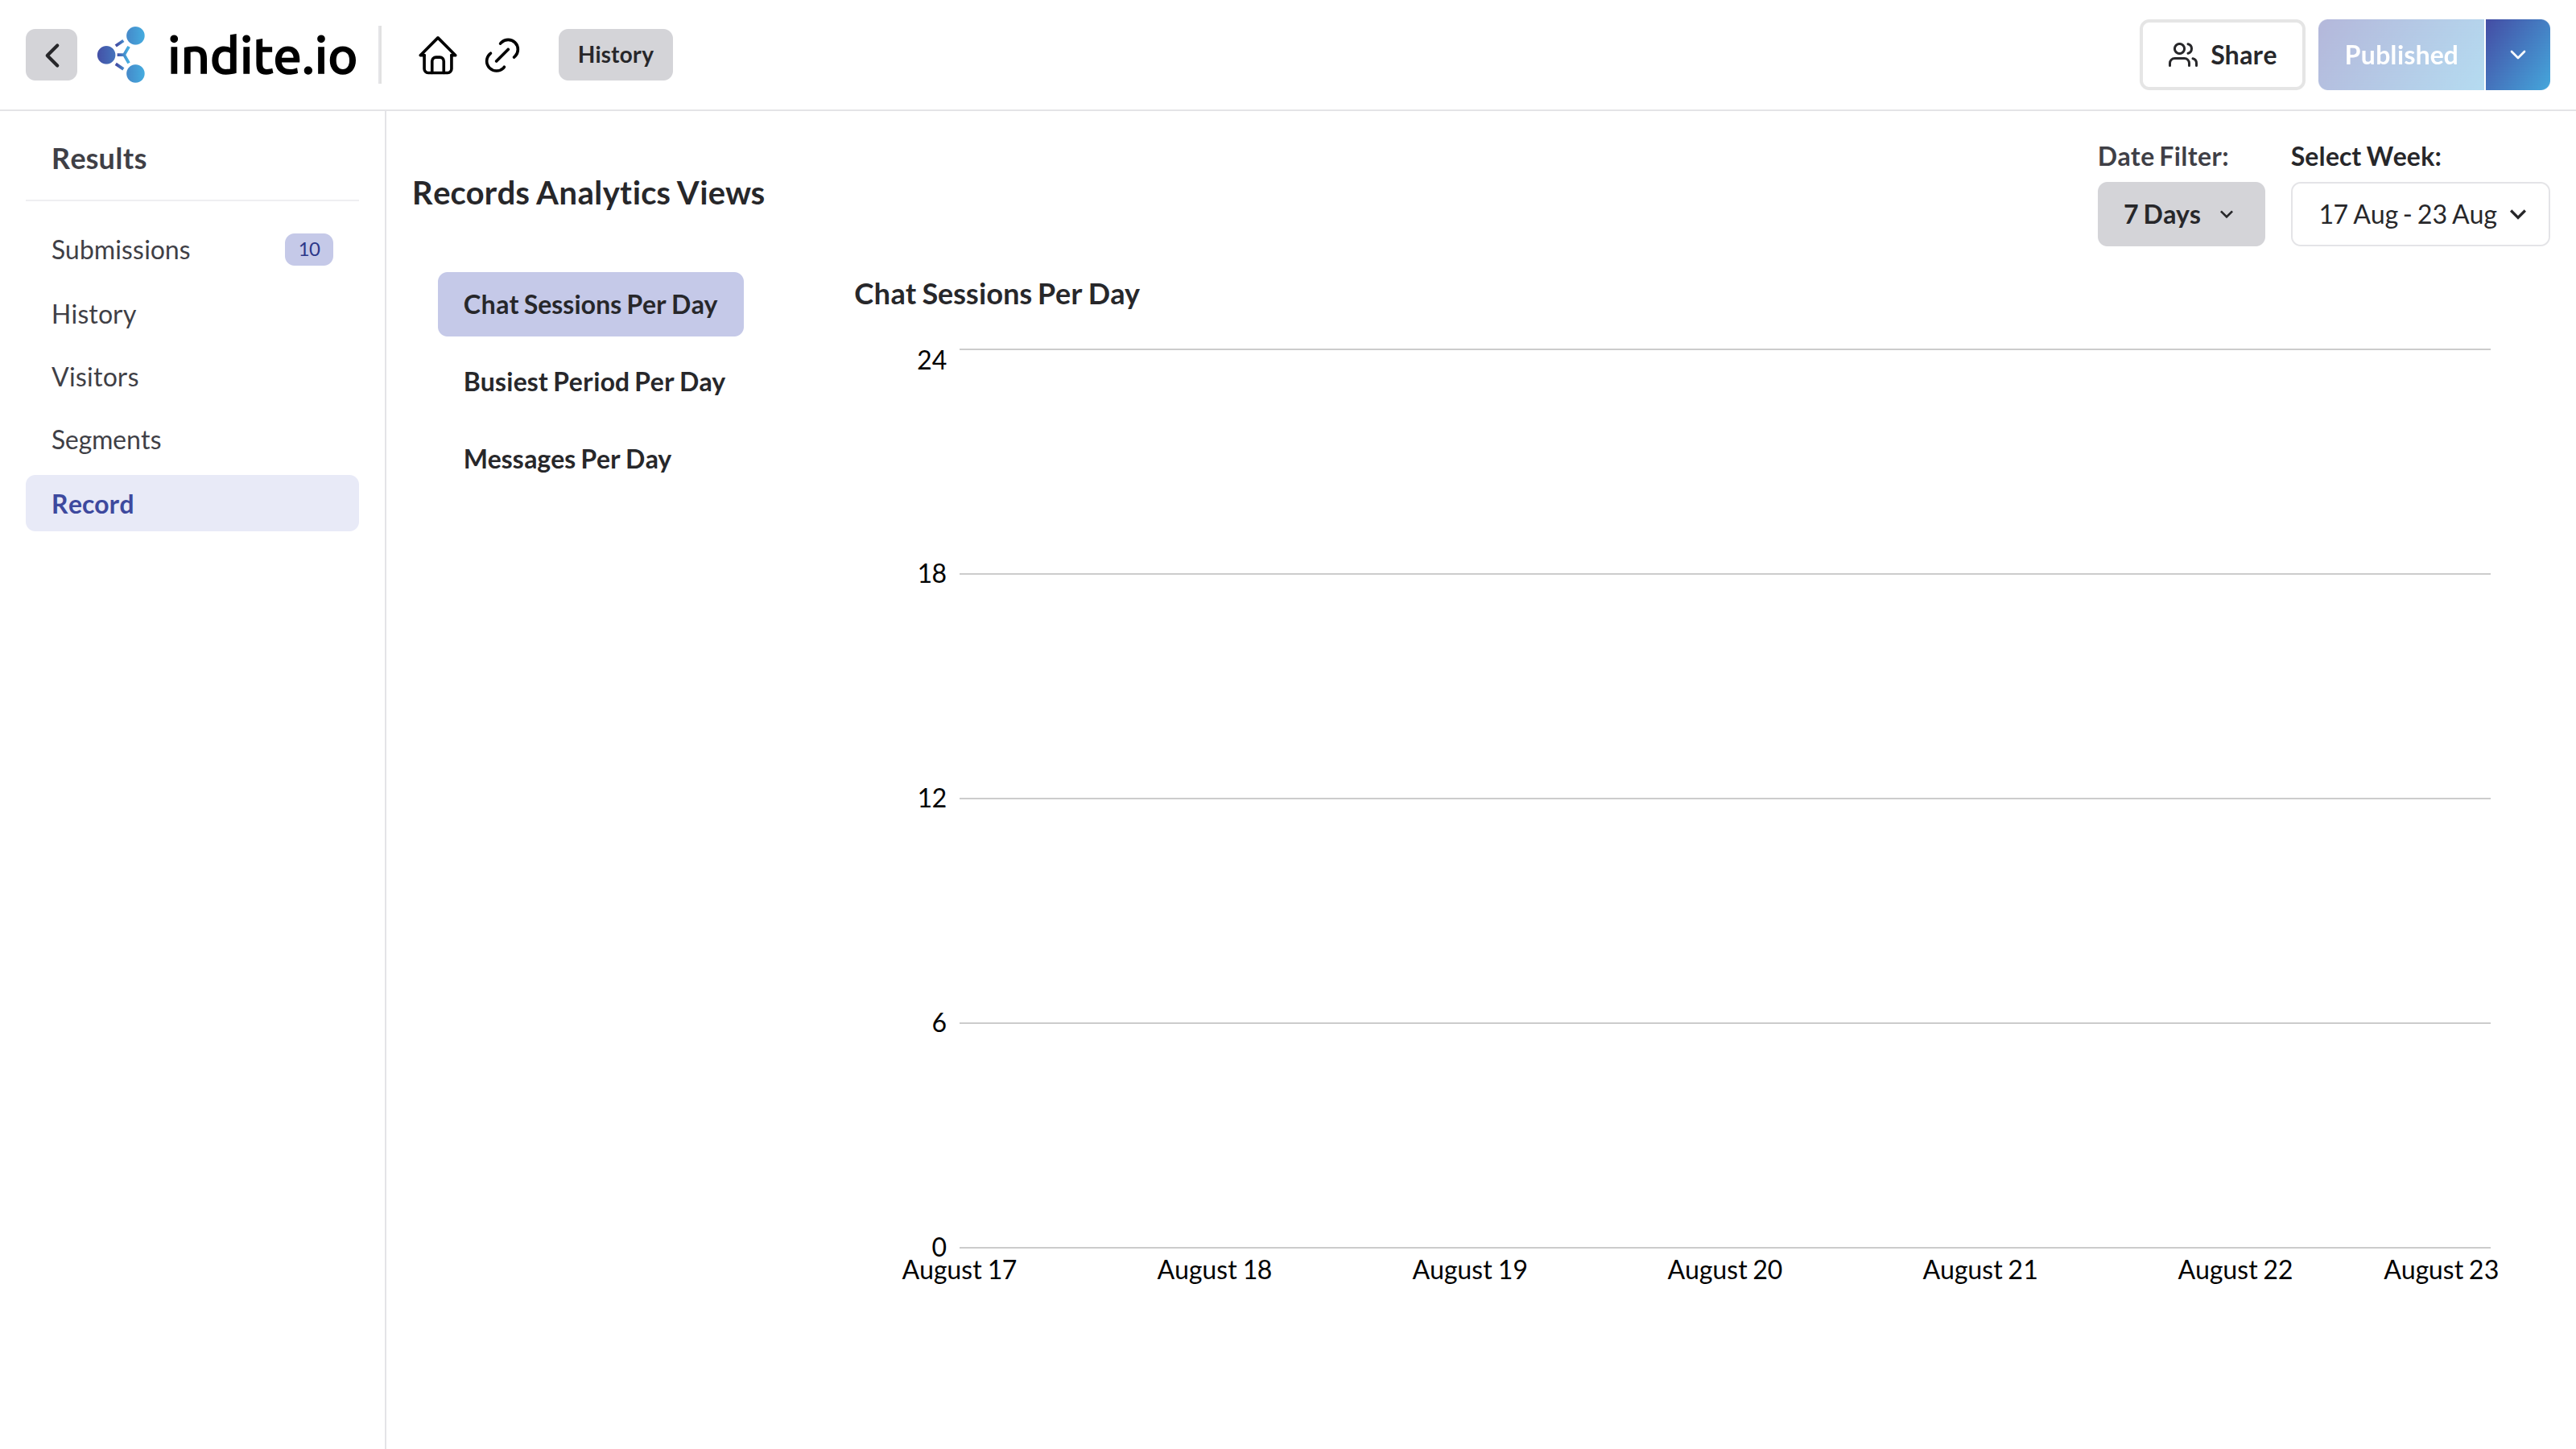
The left sidebar switches between three views:
- Chat Sessions Per Day — a line chart of how many sessions started each day over the selected range.
- Busiest Period Per Day — a day-of-week × hour-of-day heatmap showing when your bot is used most, color-coded from None to Very Low / Low / Medium / High.
- Messages Per Day — a bar chart of message volume per day, with a reference line marking the average.